GIS is not just a software tool for visualizing geographic information and displaying technical elements, such as water and electrical networks, underground galleries, services and facilities, biodiversity on site, itineraries, traffic disruptions, geology, construction planning, or building data, to name a few. It also plays a crucial role as a decision-support tool, enabling the visualization, analysis, and manipulation of spatial information, particularly in crisis situations at CERN.
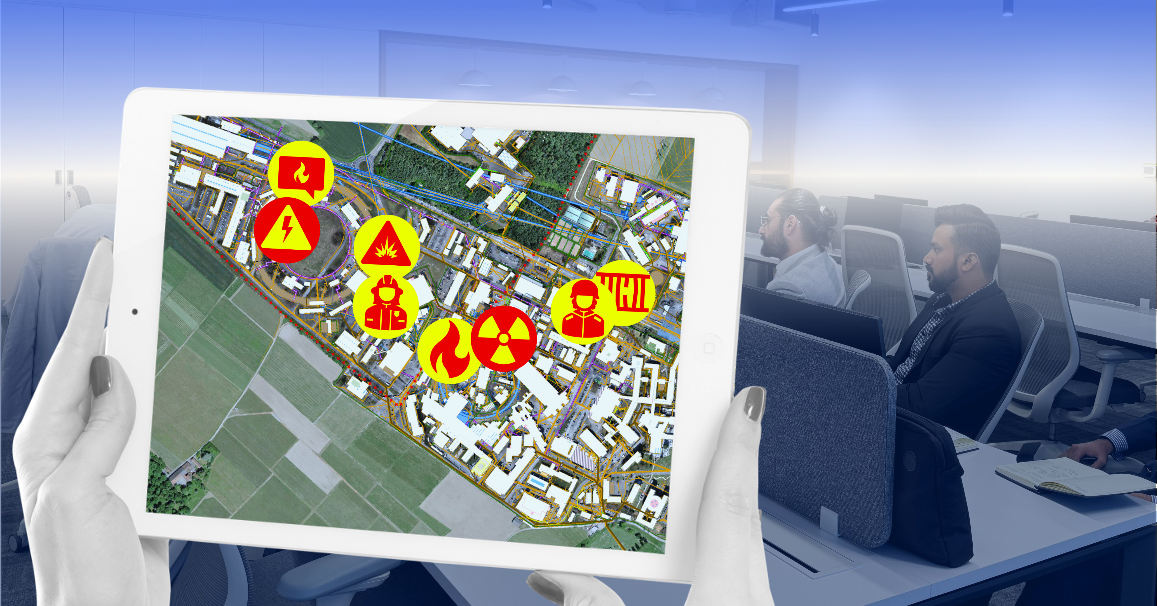
As CERN site covers a wide geographical area and involves many different technical risks, the GIS team has designed a special restricted layer that displays real-time interventions and ongoing actions in the event of a crisis to help crisis teams better understand the situation and make well-informed decisions. Specifically trained by Nicolas Guilhaudin, some members of the Silver and Bronze crisis teams can access and feed this intuitive interface providing a clear and accurate view of the situation to other stakeholders.
This interactive map was tested by SCE during a CERN crisis exercise in 2024. It has now been championed to be systematically used to support crisis management.